1 Fundamentals Link to heading
In the following subsections, fundamental terms and concepts are explained.
1.1 Types of Requirements Link to heading
1.1.1 Functional Requirements Link to heading
Functional requirements define the behavior of an application or component. Typically, these involve three main steps: data input - processing - data output. Processing can include tasks like data manipulation, calculations, storage, executing business processes, or other activities.
This type of requirement outlines what an application does.
Functional requirements describe to the software developer how an application should behave. Failure to meet these requirements implies that, from the user’s perspective, the application does not function properly.
1.1.2 Non-Functional Requirements Link to heading
Non-functional requirements describe the quality attributes of an application, such as usability, security, scalability, and many others.
While functional requirements determine what an application does, non-functional requirements detail how the system accomplishes it.
If non-functional requirements are not met, the application may continue to perform its core functions correctly. However, it can lead to a cumbersome experience for users or software developers.
1.2 Quality Attributes Link to heading
Below, some quality attributes are listed, but the list is not exhaustive.
1.2.1 Security Link to heading
- Is sensitive information transmitted or stored?
- Who can access which information?
1.2.2 Capacity Link to heading
- How much data does the application generate?
- Does data volume depend on the number of users?
- How long are data stored and archived?
1.2.3 Compatibility Link to heading
- What are the minimum hardware requirements?
- Which operating systems and versions are supported?
1.2.4 Reliability Link to heading
- What is the required probability of the application functioning as expected over a specific period?
1.2.5 Availability Link to heading
- How often and for how long can outages occur at most?
- How long can maintenance windows be?
1.2.6 Performance Link to heading
- How quickly does the application respond to user actions?
- How long does background processing take?
1.2.7 Scalability Link to heading
- What is the highest load under which the application still functions?
- At what number of users does the performance requirement no longer hold?
- Can the application be scaled horizontally or vertically?
1.2.8 Usability Link to heading
- How easy is it to use the application?
- How efficiently can a user operate the application?
- Are there different types of users?
1.2.9 Regulatory Link to heading
- Are there legal requirements that must be adhered to?
- Is compliance with other standards necessary?
1.2.10 Environmental Link to heading
- In what types of environments should the application run?
- Are separate environments used for testing, demos, reviews, etc.?
1.2.11 Maintainability Link to heading
- How long does it take to fix bugs?
- How easy is it to make changes to the application?
- How much effort is required to port the application to another platform?
1.2.12 Manageability Link to heading
- How easily can an administrator manage the application?
- How easily can damages and misinformation from bugs be rectified?
2 Metrics Link to heading
In the following subsections, various metrics for software architecture are explained.
2.1 Main Sequence Line Link to heading
In 1994, Robert Martin proposed a set of metrics for object-oriented design. These metrics do not use all attributes but focus on the relationship between packages and classes within a project.
2.1.1 Efferent Coupling (Ce) Link to heading
This metric is used to measure the relationships between classes. It represents the number of classes in a specific package that depend on classes in other packages. It allows measuring the package’s vulnerability to changes in external packages.
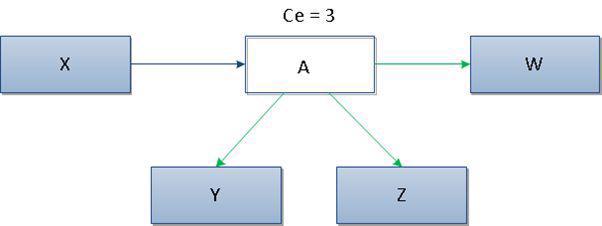
In the figure above, it can be seen that Class A has outgoing dependencies to 3 other classes; therefore, the Ce metric for this class is 3.
A high value of the Ce metric indicates the instability of a package. Changes in any of the numerous external classes may necessitate changes to the package. Preferred values for the Ce metric range from 0 to 20; higher values can cause maintenance and code development issues.
2.1.2 Afferent Coupling (Ca) Link to heading
This metric is complementary to the Ce metric and is used to measure incoming dependencies between packages. It allows us to measure the sensitivity of the remaining packages to changes in the analyzed package.
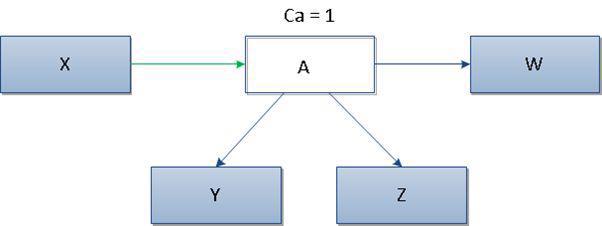
In the figure above, it can be seen that Class A has only one incoming dependency (from Class X); therefore, the value for the Ca metric is 1.
A high value of the Ca metric typically indicates high component stability. This is because the class depends on many other classes. Hence, it cannot be significantly changed, as such changes would increase the likelihood of spreading such modifications. Preferred values for the Ca metric range from 0 to 500.
2.1.3 Instability (I) Link to heading
This metric is used to measure the relative susceptibility of a class to changes. According to the definition, instability is the ratio of outgoing dependencies (Ce) to all package dependencies (Ce + Ca), and it accepts values from 0 to 1.
The metric is defined by the following formula:
Where: Ce – outgoing dependencies, Ca – incoming dependencies
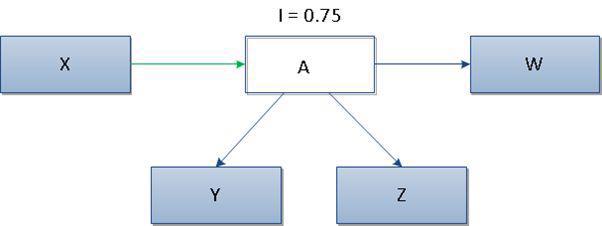
In the figure above, it can be seen that Class A has 3 outgoing and 1 incoming dependency. Therefore, according to the formula, the value of the I metric is 0.75.
Based on the value of the I metric, we can distinguish two types of components:
- Components with many outgoing dependencies (Ce) and not many incoming dependencies (Ca). These have a value of I close to 1. This suggests that they are more unstable due to many possible changes in outgoing dependencies.
- Components with many incoming dependencies (Ca) and not many outgoing dependencies (Ce). These have a value of I close to 0. They are more challenging to modify due to their higher responsibility.
Preferred values for the I metric should fall in the ranges of 0 to 0.3 or 0.7 to 1. Components should be either very stable or unstable, and components with medium stability should be avoided.
2.1.4 Abstractness (A) Link to heading
This metric is used to measure the level of abstraction of the package. By definition, abstractness is the number of abstract classes in the package divided by the total number of classes.
The metric is defined by the following formula:
Where: Tabstract – number of abstract classes in a package, Tconcrete – number of concrete classes in a package
Preferred values for the A metric should take extreme values close to 0 or 1. Packages that are stable (I metric close to 0), meaning they depend on a very low number of other packages, should also be abstract (A metric close to 1). Highly unstable packages (I metric close to 1), on the other hand, should consist of concrete classes (A metric close to 0).
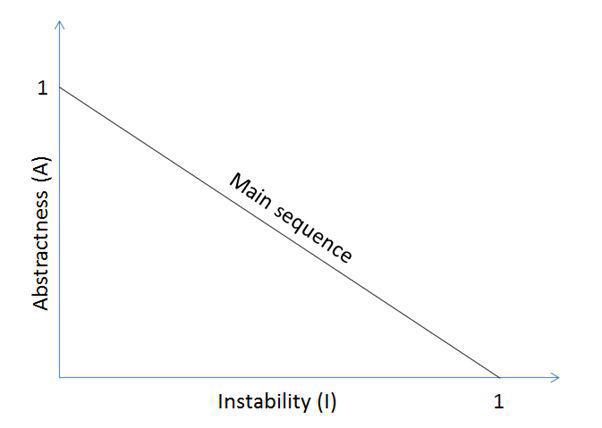
It is worth noting that the combination of abstractness and stability enabled Robert Martin to formulate a thesis about the existence of the “main sequence line,”.
In the optimal case, the instability of the class is compensated for by its abstractness, resulting in the following equation:
Well-designed classes should cluster around these graph endpoints along the “main sequence line.”
2.1.5 Normalized Distance from Main Sequence (D) Link to heading
This metric is used to measure the balance between stability and abstractness and is calculated using the following formula:
Where: A – abstractness, I – instability
The value of the D metric can be interpreted as follows. If we place a given class on the graph of the “main sequence line”, its distance from the “main sequence line” is proportional to the value of D.
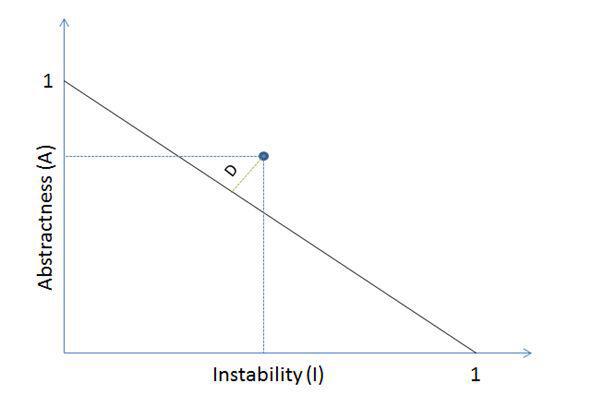
The value of the D metric should be as low as possible to have components close to the “main sequence line.” Furthermore, two extremely unfavorable cases are considered:
- A = 0 and I = 0, a package is extremely stable and rigid, which is undesirable because the package is very inflexible and cannot be extended;
- A = 1 and I = 1, a rather impossible situation because a completely abstract package must have an external connection for the instance implementing the functionality defined in abstract classes contained in this package to be created.
2.1.6 Conclusion Link to heading
Robert Martin’s metrics allow us to easily assess the relationships between packages in a project and determine whether changes are necessary to avoid potential issues in the future.
2.2 Chidamber and Kemerer Link to heading
In their work titled “A metrics suite for object-oriented design” [1], Shyam Chidamber and Chris Kemerer published six metrics for object-oriented design in 1994.
2.2.1 Weighted Methods Per Class (WMC) Link to heading
This defines the sum of all methods in a class represented by their McCabe complexity. Classes with many methods are likely to be more application-specific, limiting the potential for reuse.
2.2.2 Depth of Inheritance Tree (DIT) Link to heading
DIT represents the depth of a class in the inheritance tree, with a value of zero corresponding to root classes and multiple inheritance indicating the maximum depth. The deeper a class is in the hierarchy, the more methods and variables it likely inherits, making it more complex. Deep trees indicate greater design complexity.
2.2.3 Number of Children (NOC) Link to heading
NOC defines the number of direct subclasses of a class. The more subclasses a class has, the greater the effort required to ensure that modifying the behavior of these subclasses does not break the class. As a result, it becomes more challenging to change the class, requiring more testing.
2.2.4 Coupling between Object Classes (CBO) Link to heading
This metric measures the number of classes to which a class is coupled. Two classes are coupled when methods declared in one class use methods or instance variables defined by the other class. More coupling means that the code is harder to maintain, as changes in other classes can also lead to changes in this class. Consequently, these classes are less reusable and require more testing effort.
2.2.5 Response for a Class (RFC) Link to heading
It represents the number of methods that can potentially be called from outside the class. When the number of methods that can be called in a class is high, the class is considered more complex and may be heavily coupled with other classes. Therefore, it requires greater testing and maintenance effort.
2.2.6 Lack of Cohesion of Methods (LCOM) Link to heading
This metric measures how methods within a class relate to each other. Low cohesion suggests that the class implements more than one responsibility.
3 Tools Link to heading
In the following subsections, some tools for software architecture analysis are introduced.
3.1 CodeMR Link to heading
CodeMR is an analysis tool for software quality and static code analysis for Java, Kotlin, and Scala projects. CodeMR visualizes code metrics and quality attributes at a high level (coupling, complexity, cohesion, and size) in various views, such as package structure, TreeMap, Sunburst, dependency, and diagram views. CodeMR analyzes the source code on the local machine and stores all analysis files in a local working directory.
3.1.1 Metrics Link to heading
CodeMR provides various metrics for software analysis. Below are the groupings and explanations of some of the metrics.
Size Link to heading
Size is one of the simplest and most common forms of software analysis. The following list includes some of the metrics that CodeMR provides for size.
- CLOC (Class Lines of Code): The number of lines of code in a class.
- NOM (Number of Methods): The number of methods in a class.
- NoCls (Number of Classes): Total number of classes.
- NoE (Number of Entities): Total number of interfaces and classes.
- nofP (Number of Packages): Number of packages in the project.
- …
Complexity Link to heading
Complexity refers to being difficult to understand and describes interactions between a set of units. Higher levels of complexity in software increase the risk of inadvertently disrupting interactions, thus increasing the likelihood of introducing errors during changes.
- WMC (Weighted Method Count): The weighted sum of a class’s methods and the cyclomatic complexity of the methods.
- DIT (Depth of Inheritance Tree): The position of the class in the inheritance tree. It has a value of zero for root and non-inherited classes. For multiple inheritance, the metric indicates the maximum depth.
- RFC (Response For a Class): The number of methods that can potentially be called from outside the class.
- SI (Specialization Index): The Specialization Index metric measures the extent to which subclasses override their parent classes.
- …
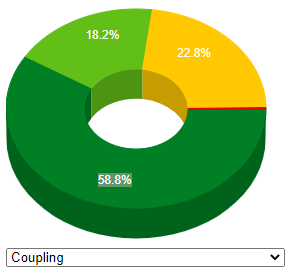
Coupling Link to heading
Coupling describes the relationship between different classes or packages.
- NOC (Number of Children): The number of direct subclasses of a class.
- CBO (Coupling Between Object Classes): The number of classes to which a class is coupled.
- EC (Efferent Coupling): The number of classes in other packages that the classes in the package depend on.
- AC(Afferent Coupling): The number of classes in other packages that depend on classes within the package.
- …
Cohesion Link to heading
Cohesion indicates how well the methods of a class are related to each other. High cohesion is generally preferred.
- LCOM (Lack of Cohesion of Methods): Shows how methods within a class are related to each other.
- LCAM (Lack of Cohesion Among Methods(1-CAM)): Measures cohesion based on parameter types of methods.
- LTCC (Lack Of Tight Class Cohesion (1-TCC)): Measures the lack of cohesion between a class’s public methods.
- …
3.1.2 Visualization Link to heading
CodeMR can perform visualizations at the project or package level, and various types of visualizations can be selected. Below are some types of visualizations.
Distribution Link to heading
To display the distribution of a metric, a Metric Distribution Diagram can be used. It represents a single metric across the project or package.
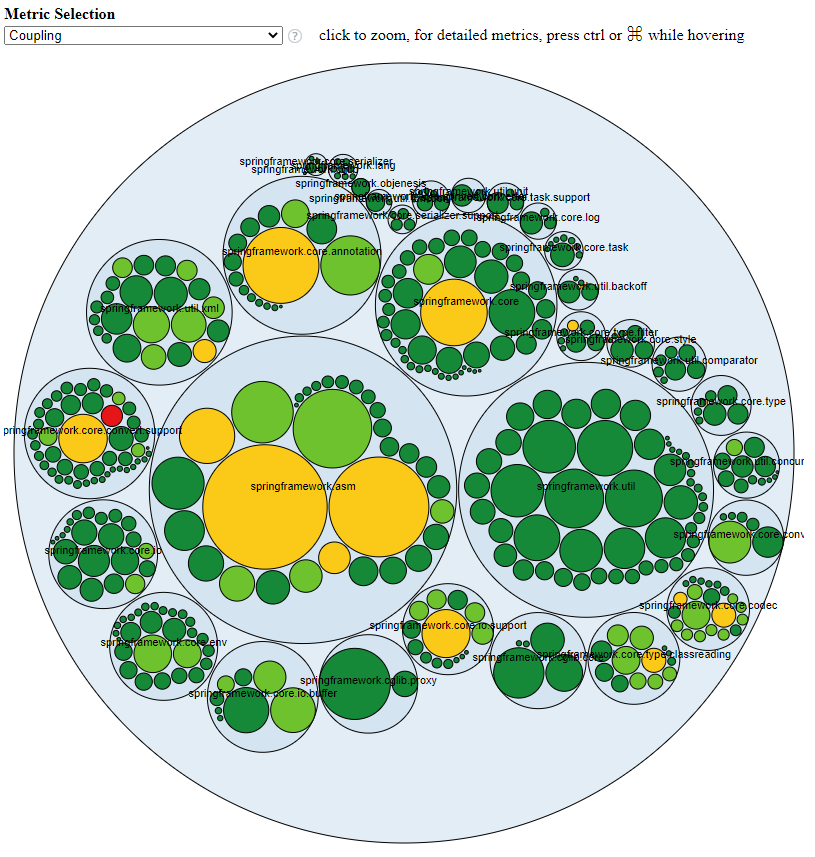
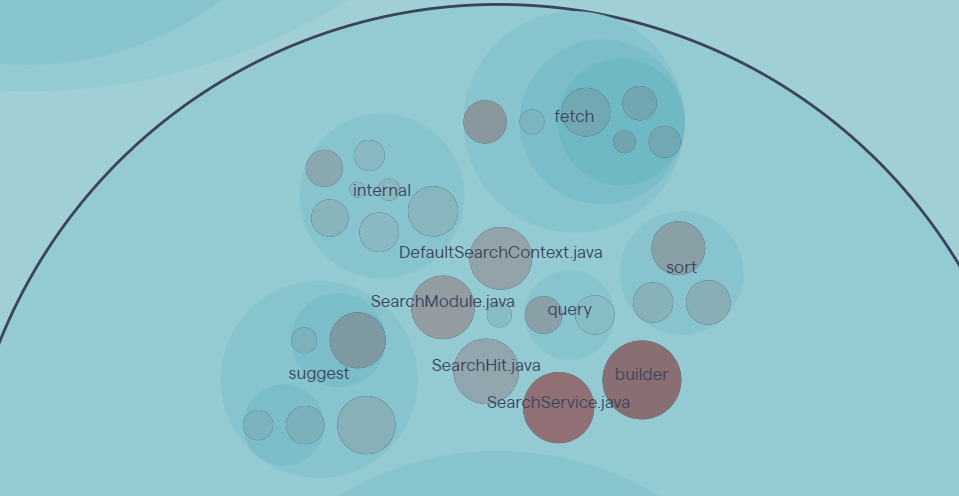
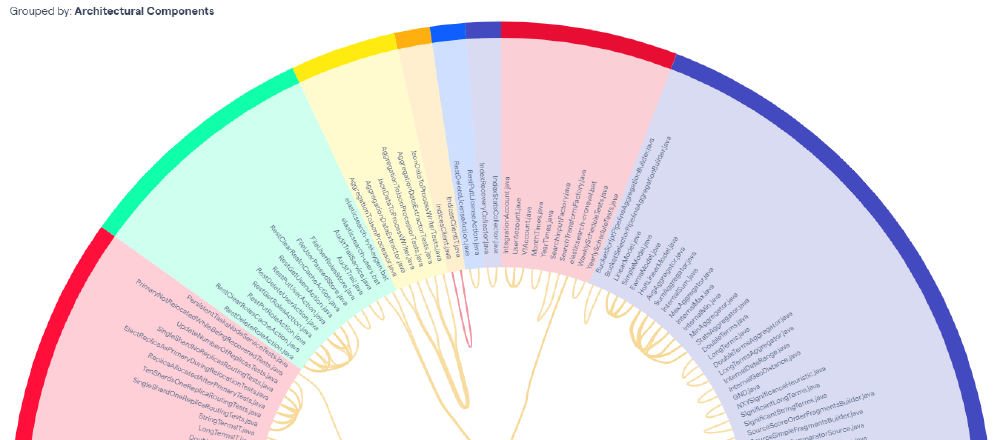
Package Overview Link to heading
In the Package Overview, classes and packages are depicted as bubbles. Additionally, the color scheme can be switched based on various metrics.
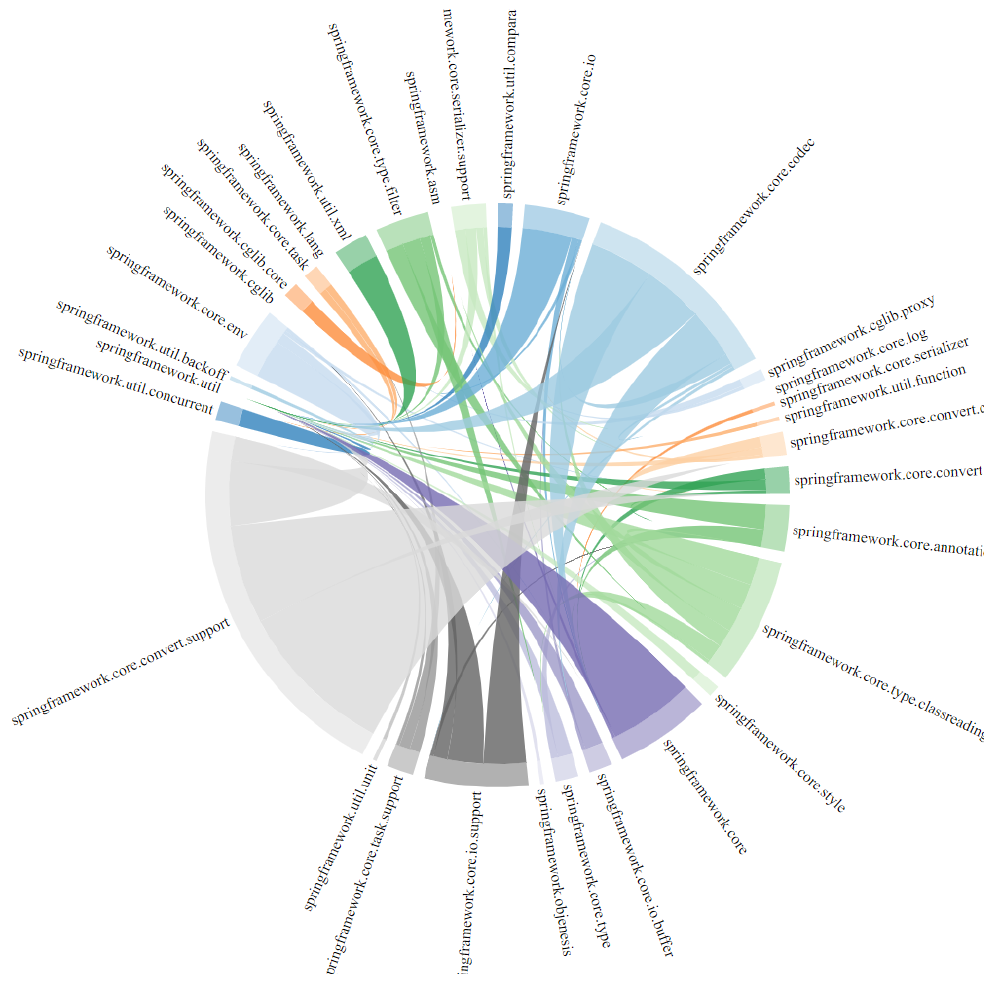
Package Dependencies Link to heading
With the Package Dependencies Diagram, all dependencies of an individual package can be quickly and easily identified and analyzed.
Graph Link to heading
Another diagram is the Graph diagram, where classes are represented as nodes grouped in packages, and arrows depict dependencies.
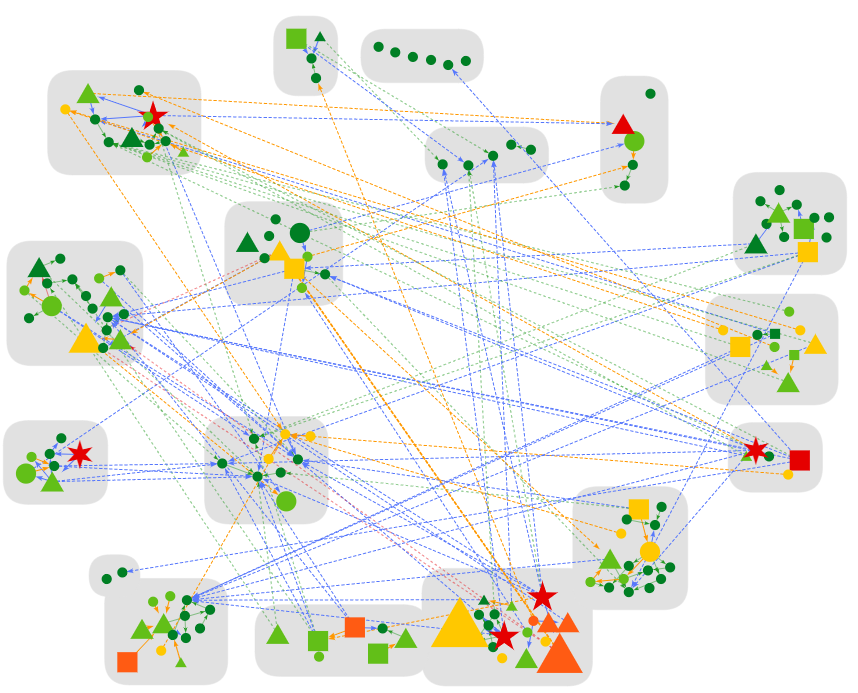
Visual properties of a node in the diagram include its color, size, and shape. Each quality attribute is assigned to various physical properties of a node.
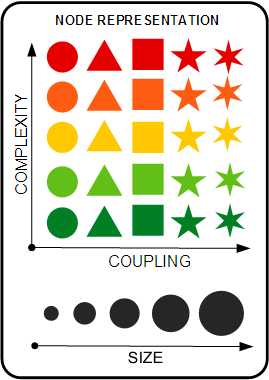
- Color: Indicates the complexity of the entity. Complexity changes the color scale into a green-to-red spectrum. Colors become warmer as the complexity of an entity increases.
- Shape: As the coupling of a class increases, the node’s shape becomes more angular. A class with high coupling has more corners, indicating more interaction points with other classes. A circle represents low coupling, while a six-sided star represents very high coupling.
- Size: The area of the shape represents the size of the class; as the number of lines of code in the class increases, the node becomes larger.
Additional Information Link to heading
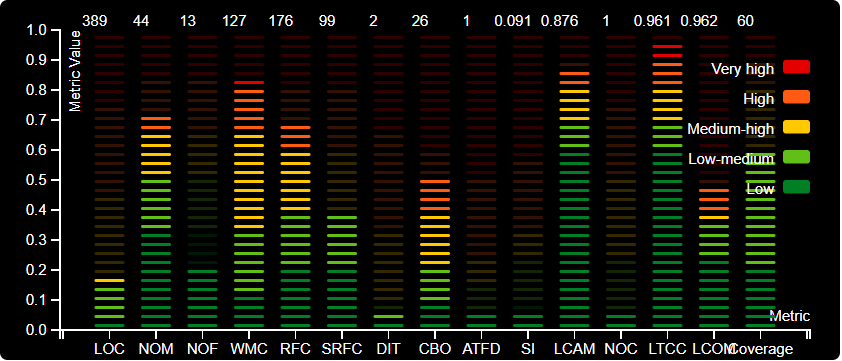
In various diagrams, detailed evaluations for classes or packages can be displayed. As shown in the following figure, various metrics can be evaluated.
3.2 CodeScene Link to heading
CodeScene is a multipurpose tool that analyzes both technical and social aspects of code. In addition to metrics like Lines of Code, it also incorporates commit frequency.
3.2.1 Visualization Link to heading
The following subsection presents some visualizations and analyses provided by CodeScene.
Hotspots Link to heading
Most code changes typically occur in relatively few packages. A hotspot analysis identifies the packages where most time is spent on changes.
Hotspots serve as a starting point for prioritizing productivity loss.
Code Health Link to heading
The Code Health metric is based on known patterns that increase maintenance costs and make the code harder to understand. This increases the risk of changes and slows down maintenance and development. The Code Health Score is calculated from various factors, including the following:
- Brain Method: A single method that centralizes too much behavior and becomes a local hotspot.
- Developer Congestion: Code that becomes a coordination bottleneck when multiple developers work on it in parallel.
- Don’t Repeat Yourself Violations: CodeScene detects duplicate logic that changes together in predictable patterns.
- Primitive Obsession: Code that uses a high amount of built-in primitives like integers, strings, and floats often lacks a domain language that encapsulates the validation and semantics of function arguments.
- …

This figure shows a snippet of the Code Health analysis for the Elasticsearch showcase. Code Health trends can be automatically monitored in a CI/CD pipeline.
Change Coupling Link to heading
Change Coupling detects when two or more classes are jointly modified over a certain period. Change Coupling itself is neither good nor bad; it depends on which classes are coupled and for what reason they are evolving together. Classes are considered Change Coupling if one or more of the following conditions are regularly met.
- The classes are edited in the same commit.
- The classes are changed by the same developer within a certain time.
- The commit messages for the changes refer to the same ticket.
Knowledge Distribution Link to heading
The Knowledge Distribution analysis measures various aspects, including but not limited to:
- Coordination bottlenecks: Parts of the code where multiple teams need to coordinate their work.
- Knowledge Island: The majority of the code was written by a single developer.
- Complex Code by Former Contributors: Represents code with low code health, with most of this code written by former contributors.
3.3 JDepend Link to heading
JDepend is an open-source software analysis tool for Java. JDepend goes through classes and generates software architecture metrics for each package. With JDepend, the quality of an architecture can be automatically measured in terms of extensibility, reusability, and maintainability, effectively managing and controlling package dependencies.
3.3.1 Metrics Link to heading
JDepend analyzes the following metrics:
- Number of classes and interfaces: The count of concrete and abstract classes (and interfaces) in the package.
- Number of concrete classes (CC): The count of concrete classes in the package.
- Number of abstract classes (AC): The count of abstract classes (and interfaces) in the package.
- Afferent Couplings (Ca): The count of other packages that depend on classes within the package.
- Efferent Couplings (Ce): The count of other packages from which classes in the package depend.
- Abstractness (A): The ratio of the number of abstract classes (and interfaces) in the analyzed package to the total number of classes in the analyzed package.
- Instability (I): The ratio of Efferent Couplings (Ce) to the sum of Couplings (Ce + Ca).
- Distance from the Main Sequence (D): The vertical distance of a package from the “main sequence line.”
- Package Dependency Cycles: Lists packages with cyclic dependencies.
3.3.2 Reports Link to heading
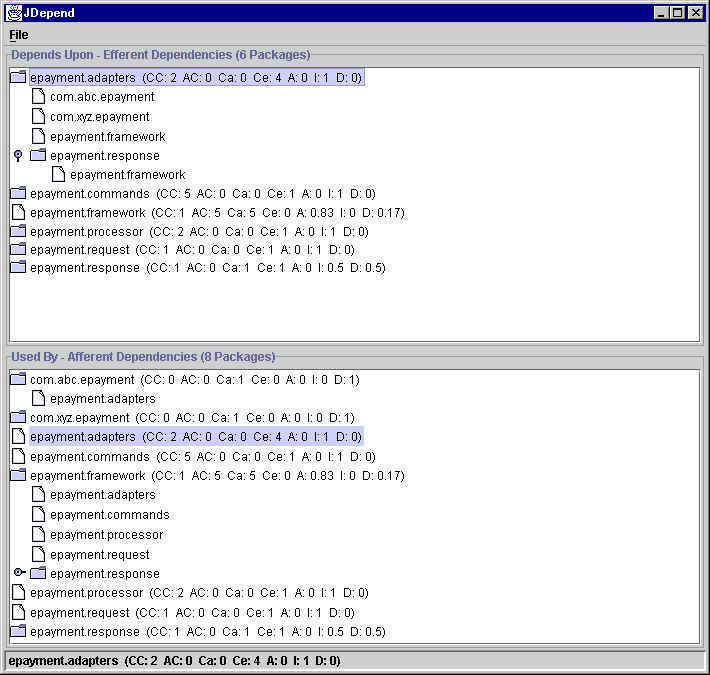
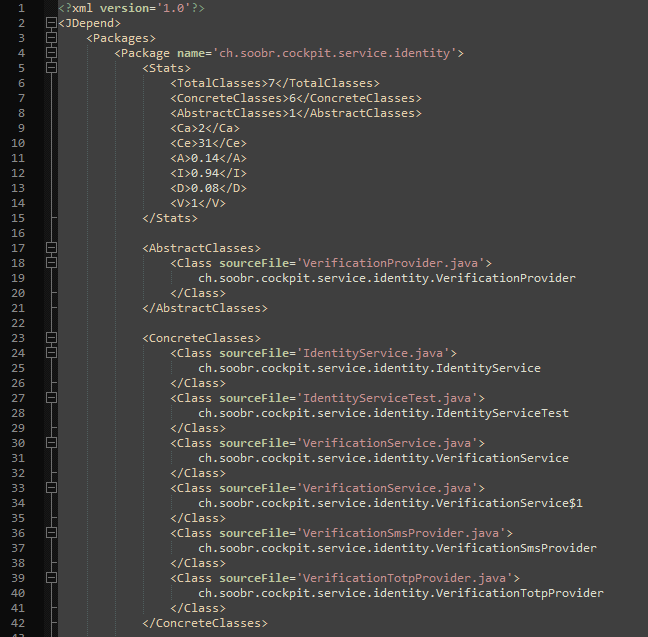
JDepend provides reports in textual or XML-based files, as well as a graphical user interface.
Graphical User Interface Link to heading
XML-Based Report Link to heading
4 Fazit Link to heading
Für die Analyse von nicht funktionalen Anforderungen in Bezug auf Softwarearchitektur gibt es diverse Metriken. Die meisten davon beziehen sich auf die Abstraktion und das Coupling von Klassen. Dabei gibt es nicht eine perfekte Klasse, unterschiedliche Werte werden erwartet für verschiedene Arten von Klassen.
Die drei untersuchten Tools zur automatisierten Auswertung von Softwarearchitektur-Metriken haben alle ihre Vor- wie Nachteile.
CodeScene gibt sehr einfach verständliche Aussagen über die Qualität der Softwarearchitektur und des Codes wieder. Zudem kann das Tool einfach in eine CI/CD-Pipeline eingebunden und somit eine automatisierte Auswertung vorgenommen werden. Leider sind die meisten Werte des Tools eine Mischung aus diversen Metriken, weshalb es nicht möglich ist genaue Aussagen über spezifische Aspekte der Softwarearchitektur zu machen. JDepend ist ein sehr minimalistisches Tool, dass sich auf wenige Metriken konzentriert. Die von JDepend erfassten Werte beziehen sich stark auf die von Robert Martin vorgeschlagen Metriken rund um die ”main sequence line”. Leider ist die Nutzung des Tools eher beschwerlich und die Visualisierung für grössere Projekte kaum nutzbar. CodeMR ermöglicht die einfache Visualisierung vieler Softwarearchitektur-Metriken. Wodurch ein schneller Verständnisaufbau der Architektur ermöglicht wird. Jedoch ist das Tool kaum geeignet für automatisierte Auswertung in einer CI/CD-Pipeline, da die Auswertungen manuell überprüft und interpretiert werden müssen.
4 Conclusion Link to heading
There are various metrics for analyzing non-functional requirements related to software architecture. Most of them pertain to the abstraction and coupling of classes. There is no single perfect class; different values are expected for different types of classes.
The three examined tools for automated evaluation of software architecture metrics all have their pros and cons.
CodeScene provides easily understandable insights into the quality of software architecture and code. Moreover, the tool can be easily integrated into a CI/CD pipeline for automated evaluation. Unfortunately, most of the tool’s values are a combination of various metrics, making it difficult to make precise statements about specific aspects of software architecture.
JDepend is a very minimalist tool that focuses on a few metrics. The values captured by JDepend strongly relate to the metrics proposed by Robert Martin around the “main sequence line.” Unfortunately, using the tool is rather cumbersome, and the visualization is hardly usable for larger projects.
CodeMR enables the straightforward visualization of many software architecture metrics, facilitating a quick understanding of the architecture. However, the tool is hardly suitable for automated evaluation in a CI/CD pipeline since the evaluations need to be manually reviewed and interpreted.
Original and Sources Link to heading
- original presentation (german)
- original document (german)
- aivosto: Chidamber and Kemerer object-oriented metrics suite
- codemr: Measure, visualise and improve your code quality
- codescene: See the invisible. Know your priority
- future-processing: Object-oriented metrics by Robert Martin
- github - JDepend
- perforce: What are Non Functional Requirements — With Examples
- scand: Functional vs Non-Functional Requirements: The Definitive Guide
- S.R. Chidamber and C.F. Kemerer. A metrics suite for object oriented design. IEEE Transactions on Software Engineering, 20(6):476–493, 1994.